
See how your audience reacts, second by second.
Alyze analyzes facial expressions through a standard webcam and turns them into a clear report on emotional response and attention, so the next decision rests on how people actually react.
A real study, run on Alyze.
A production company tested a 22-minute short film, its trailer and two posters before release, with viewers in the United States and the United Kingdom.
100
viewers completed each test
4 cities
New York, California, London and Birmingham
22 min
of film read second by second
Excellent
data quality, as rated by the platform
Inside the report.
Real screens from that study, exactly as the platform shows them. Choose a view to see what each part of the report tells you.
Play the content and read, moment by moment, how much attention it holds, how strongly people react and which emotions they show.
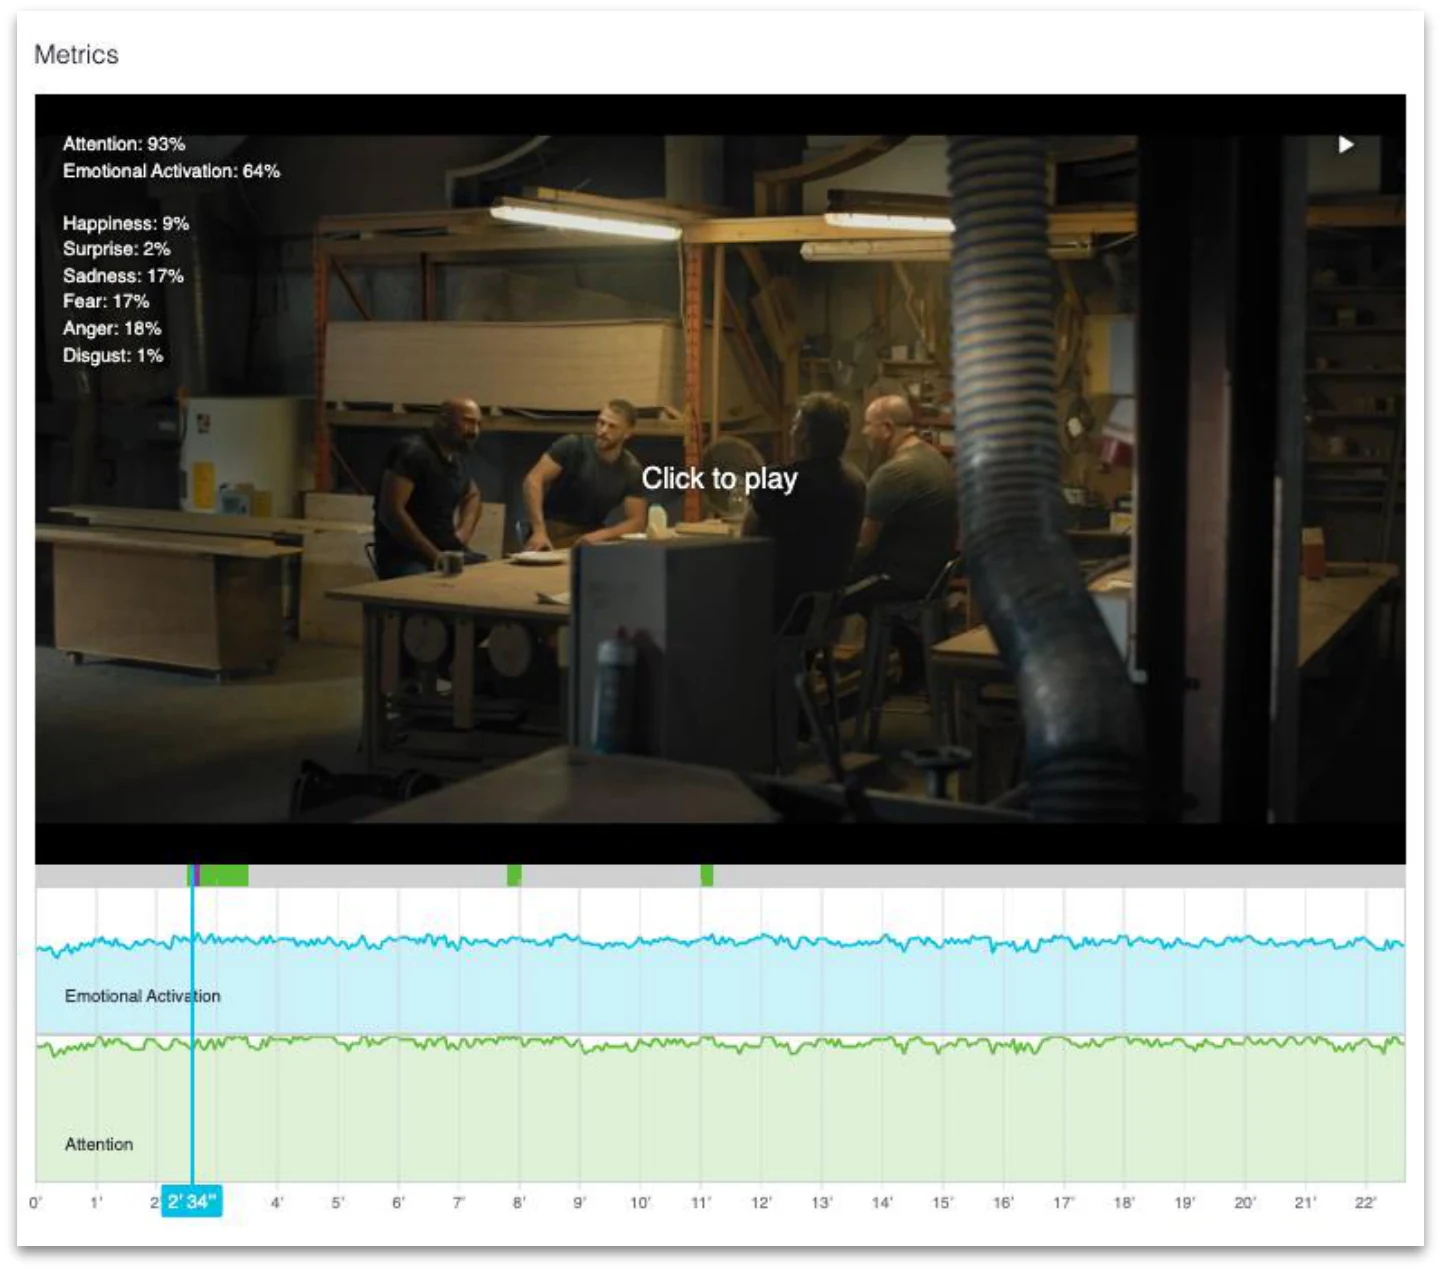
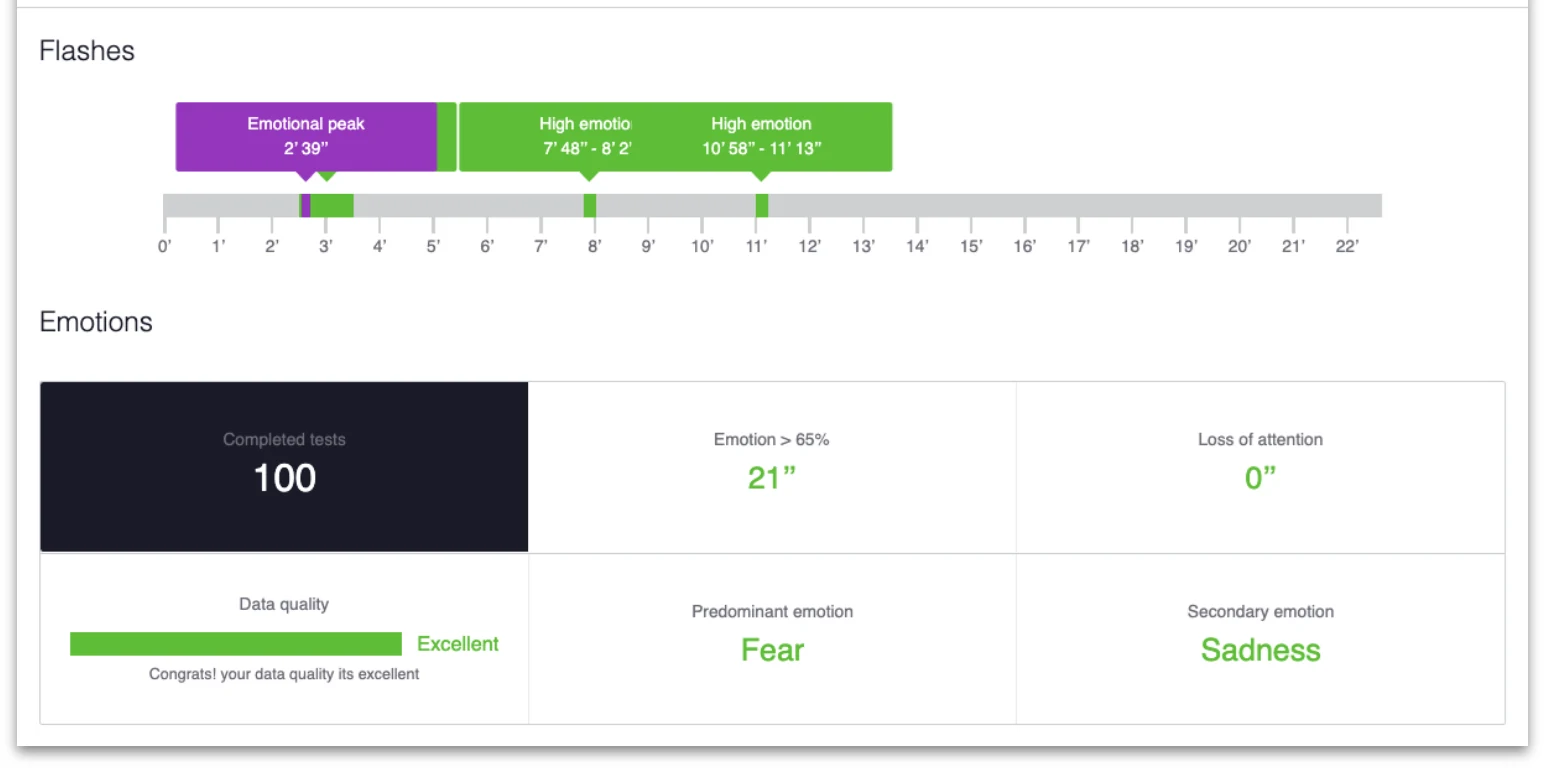
The emotional peak and every stretch of high emotion, marked on the timeline, with the time spent above 65% emotion, the attention lost and the predominant emotions.
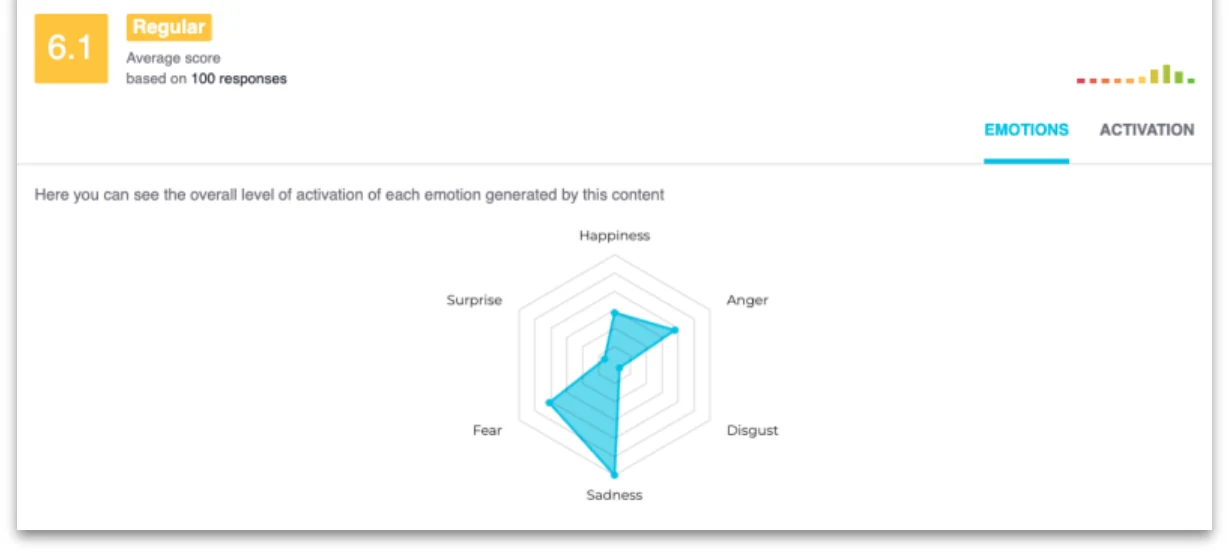
An overall score out of 10 with how the responses are distributed, and the balance of the six emotions: happiness, surprise, anger, disgust, fear and sadness.
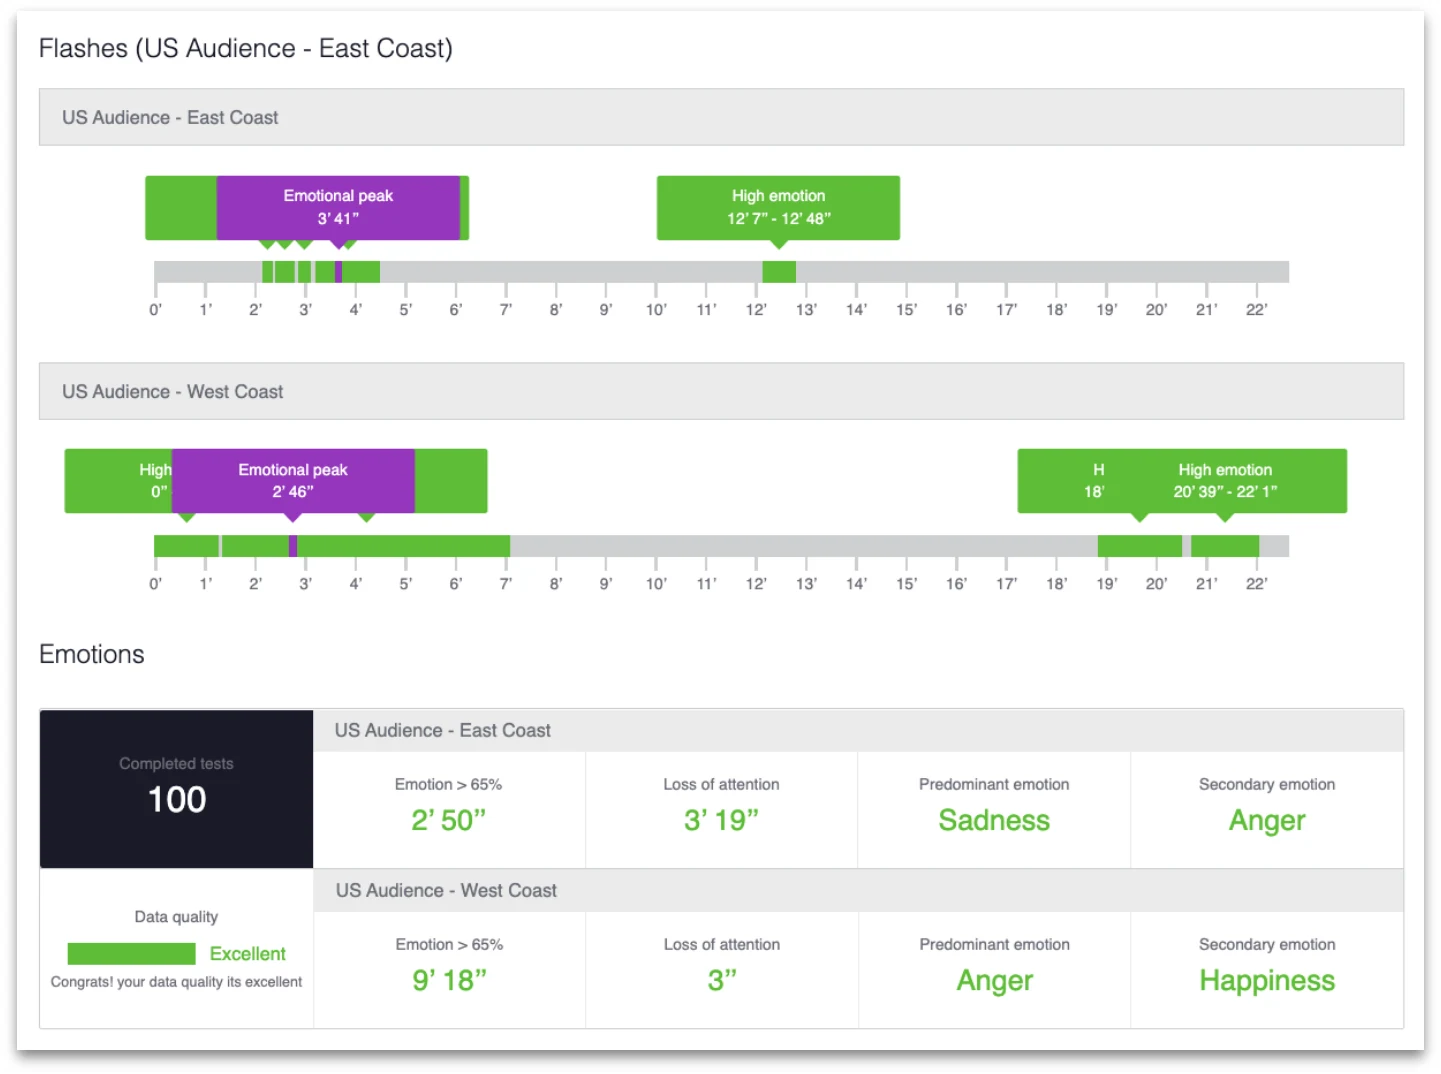
The same content read by different audiences. Here, viewers on the US East and West Coasts reacted to the same film in very different ways.
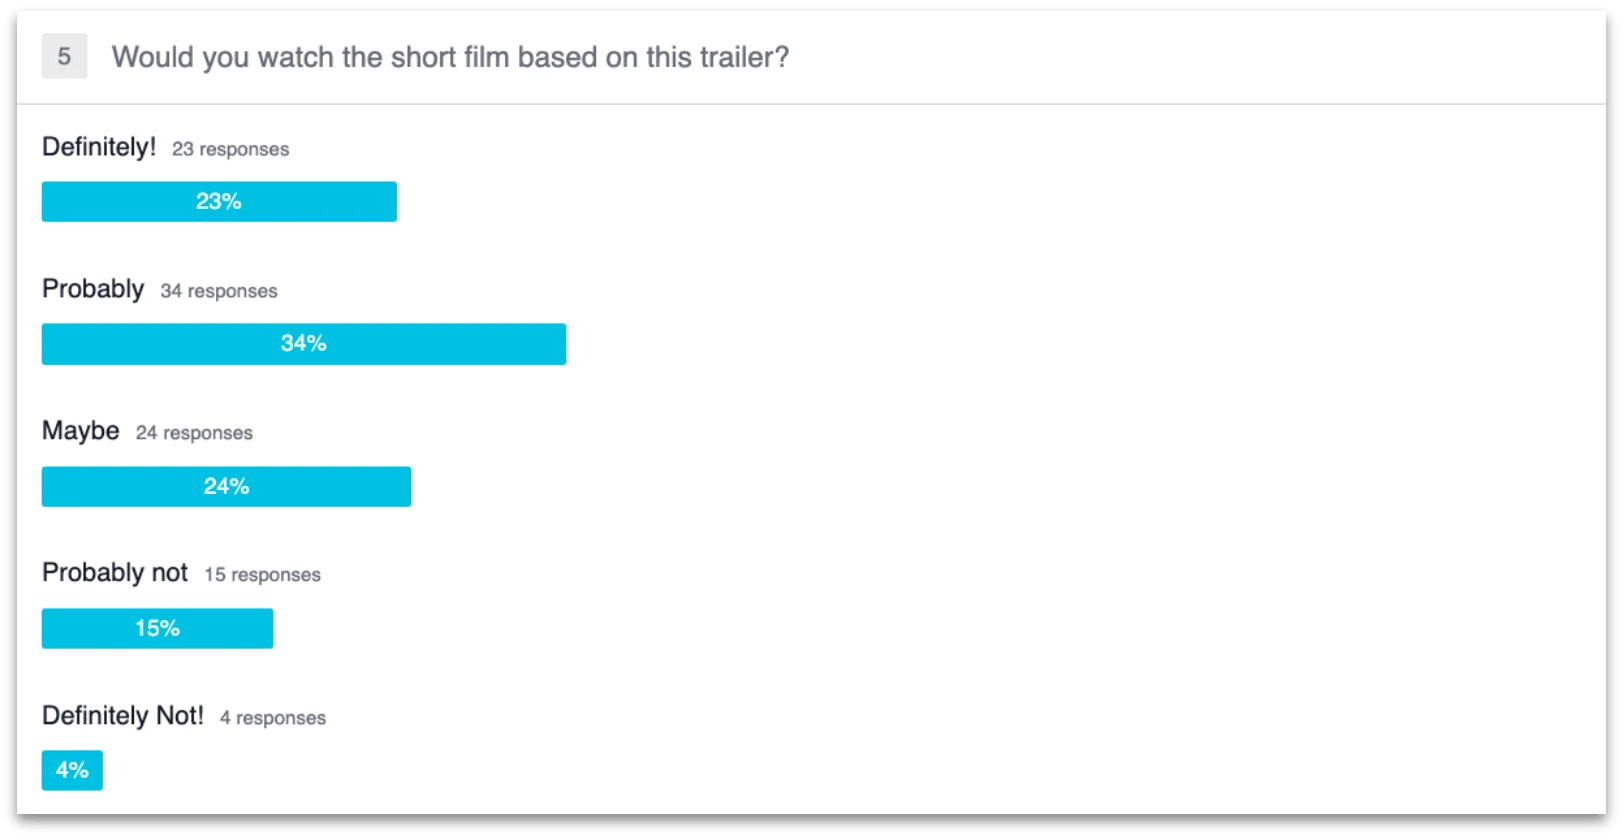
Ask your own questions inside the test and read the answers next to the emotional data.
From your content to the report.
Everything happens inside the platform, from choosing the kind of test to reading the results for each audience group.
Alyze Business
For brands and agencies.
Alyze Studio
For entertainment: films, series and trailers.
Alyze Custom
For any other study.
Choose the test
Business, Studio or Custom, depending on what you need to learn.
Make it yours
Add your brand to the page participants see.
Upload the content
Videos, ads, trailers or images such as posters.
Define the audience
Groups by country, gender and age, from your own viewers or the Alyze panel. People must agree to be recorded.
Read the report
Results for every group, second by second, next to the answers to your questions.
Under the hood
Cloud platform
Fully online, so there is nothing to install on your side.
The AI engine
Deep learning models built on convolutional neural networks and trained on faces from different countries.
Compared in the lab
Results are compared with measures such as EEG, galvanic skin response and eye tracking, and with established facial coding methods.
Read in context
Results are adapted to each type of content and interpreted with expert guidance.

What the audience showed them.
Some of the findings from the study of the short film, its trailer and its two posters.
- 6.1
out of 10 for the trailer, in the middle range, with sadness as the main emotion (19%), followed by fear and anger.
- 62%
of viewers chose the same poster, although both posters produced the same emotional score. What people feel and what they pick do not always match.
- 21 s
of the film stayed above 65% emotion across the whole audience, with no accumulated loss of attention.
- 9:18
above that threshold for viewers on the West Coast, against 2:50 on the East Coast, where people were also distracted for 3:19. Same film, different audiences.
- 78%
said nothing was confusing when asked openly. When they were shown specific options, only 47% still said so.
Wherever a reaction changes the decision.
The same measurement works for very different content, from a product concept to a streaming premiere.
Entertainment
Test films, series, trailers and posters with audience reactions before they are released.
Advertising
Compare the emotional response to different versions of an ad and choose with data in hand.
Retail and banking
See how people respond to products, packaging and financial communication before launch.
Remote research
Run studies with participants who join from home through a standard webcam.

Tell us what you want to measure.
Share what you want to test and who should see it, and we will walk you through a demo with content like yours.